How to debug a VBScript program running from Mechworks PDM
It's assumed a Visual Studio IDE is installed on the workstation.
Another tool for debugging VBScript programs is the Microsoft Script Editor (MSE7.EXE, available up to Office 2007).
More, starting from R13 a MWAPI environment has been delivered; it's fully debuggable with Visual Studio 201x.
Please refer to specific help module MwPDMApi.chm you can download from the Mechworks website
Usage
To use the debugger, you've to attach the script running process to a debug environment, then it's possibile to go into it as step-by-step mode.
Finally you have all the features to perform debugging: step out, step in, watch variables, insert breakpoints, etc.
Settings
Make sure the last vbscript engine ver.5.6 is installed (available as download from Microsoft).
Then, you have to modify a registry key (JITDebug, get from Microsoft knowledge base) to enable the debug mode.
Debug using VB201x
Here below it's explained how to associate the VisualBasic editor to the Debug process of a MechworksPDM LST/VBS/LIB script.
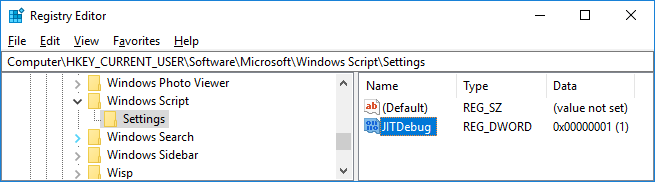
1.Add/Change the registry setting of the key [HKEY_CURRENT_USER\Software\Microsoft\Windows Script\Settings] as follows:
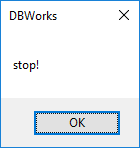
2.Place a message box in the script you want to debug (at the begin of the script so to stop it when it starts):
Sub main()
DBWMsgBox "stop!"
DBWINIT(TRUE)
DBWShell("GetActiveDocUniqueId")
...
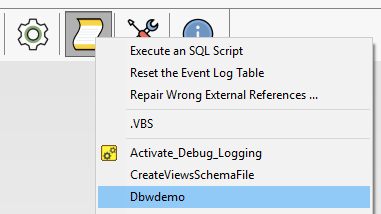
3.Execute the script from MechworksPDM:
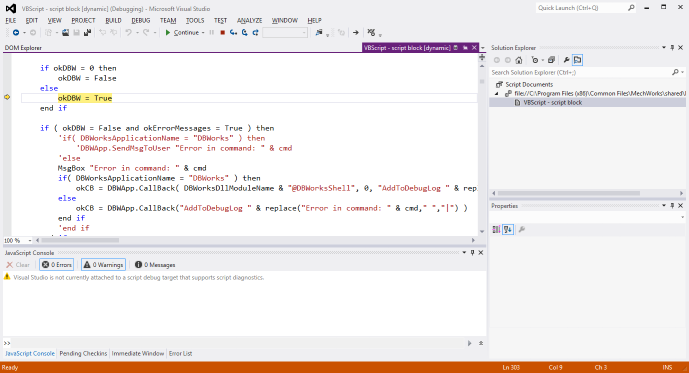
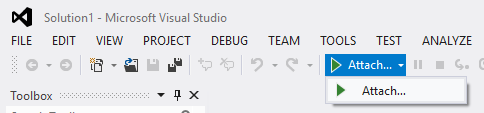
4.When the message box opens, leave it open and go to Visual Studio
5.Select Attach...
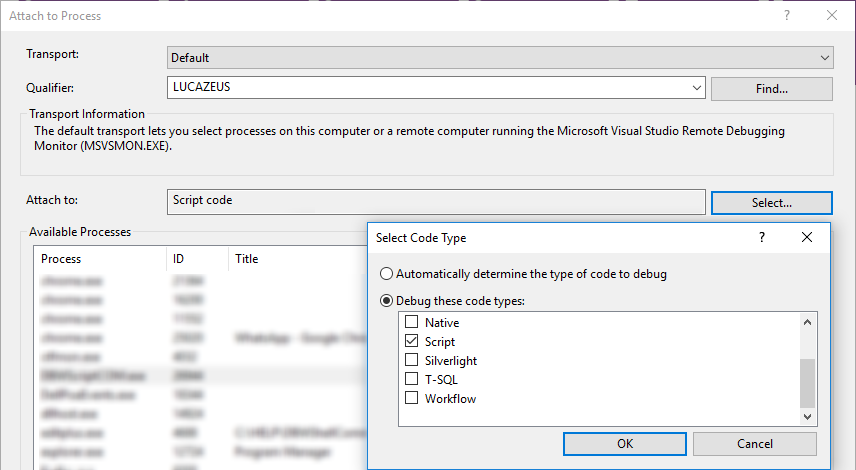
6.Modify the Code Type to attach to:
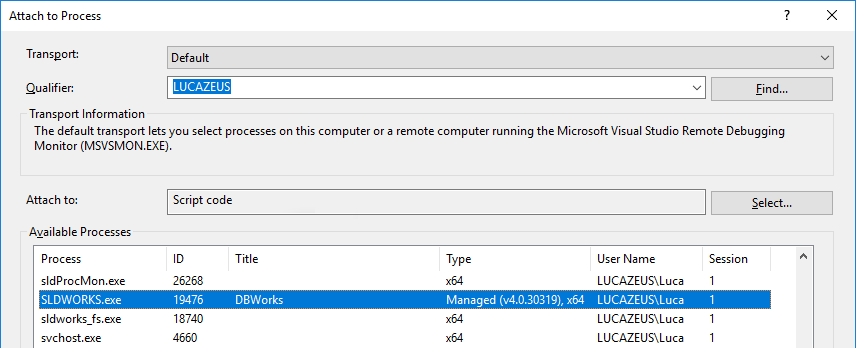
7.Depending on the script, select the proper script process:
•If the script contains a directive '.x64 in its very first line (script runs in process) Select SLDWORKS.exe, then
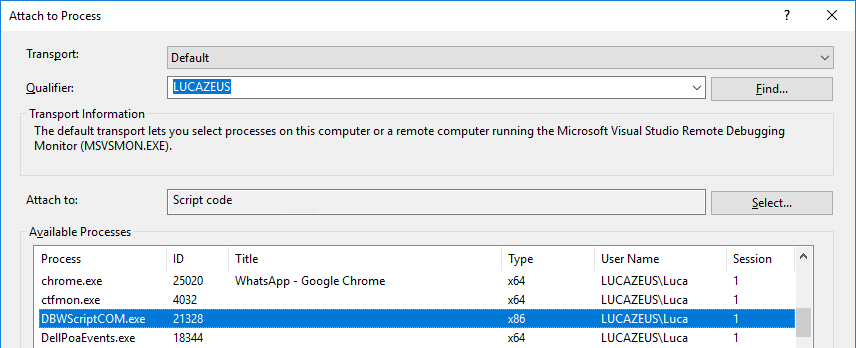
•If the script doesn't contain any directive at its very first line (common script runs out of process) Select DBWScriptCOM.exe, then
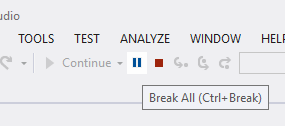
8.Then select Pause.
9.Go back to the dialog and click OK

10.Now debugging is active