Troubleshooting - Log files
If you ever encounter a problem, a malfunctioning or a possible bug, please contact your reseller and where necessary send an email with a description of your problem and of your current configuration at [email protected].
Execution Tracing
Enable Tracing
DBWAclServer log files
TaskManager log files
License Manager log files
Installation log files
Performance log files
Log Analyzer
MechworksPDM Execution Tracing (Administrators only)
A set of parameters is available in MechworksPDM so as to debug working sessions that have problems not solvable with the normal e-mail support provided by MechWorks. If you experience unexpexted behaviour, the best way to send information to the MechWorks support is to describe the problem with an e-mail, and to attach the log file that will be generated when the Execution Tracing is enabled.
The standard log fileS are named
DBWORKS_<date>_<time>.LOG
and starting from R20 release also
DBW_FilePathMonitor_<date>.LOG
they are both necessary and they are written in the %TEMP% directory.
Having separate log files for different dates allows multisession log files.
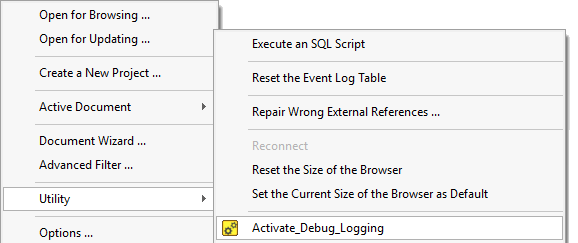
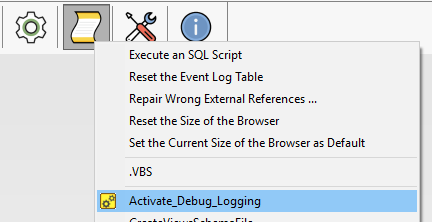
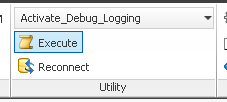
Enable tracing
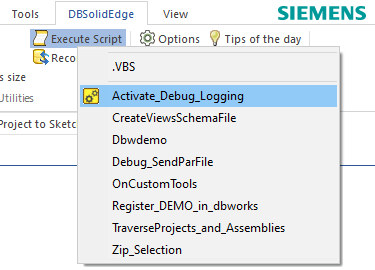
To enable the logging process in the simplest way, from the MechworksPDM menu in the CAD interface, choose Utility→Activate_debug_logging script
|
|
|
|
|---|---|---|---|
Solidworks menu |
DBWorks toolbar script menu |
DBInventor ribbonbar |
DBSolidEdge ribbonbar |
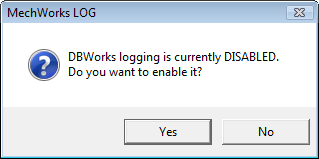
A dialog informs about the current state of the logging (enabled or disabled)
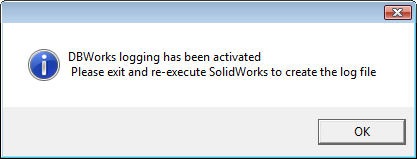
Then a confirmation of disabling/enabling is shown
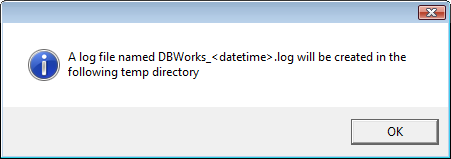
Finally another dialog tells you where to find the generated log and last, such temp folder is opened for your practicalness
After that you can start performing actions that lead to the issue reproducing.
Please note it's very important to log as few actions as possible to reduce the analyzing time and focusing on the actual issue.
Since you don’t need to restart CAD application to enable log creation, we strongly suggest to prepare the environment before activating the log.
In the end, after have the problem logged, disable the tracing by running again Utility→Activate_debug_logging.
DBWAclServer log files
In case the issue involves DBWACLServer or you have been asked by Mechworks Support Team to provide log for it, you've to send -together with standard log- also specific client and server log.
Before start recording the issue, on the server, please delete the current logifle so to track necessary actions only: %PROGRAMDATA%\Mechworks\DBWACLServer\Logs\DBWAclServer.log
The client log is in the client temporary folder: %TMP%\DBWAclClient.log
If present, please send also: %TMP%\DBWMSG.log
If present, please remember to send together with the logs also the DBWACLServerADM.txt file that's located in %ProgramData%\MechWorks\DBWAclServer or in the same folder of the executable of the service.
Typical step by step procedure to log an issue
Suppose the issue is related to DBWAclServer so you need to provide both standard log and DBWAclServer specific log.
1.Make sure tracing is disabled
2.Close the CAD application
3.[*] On the file server remove/rename the file %PROGRAMDATA%\Mechworks\DBWACLServer\Logs\DBWAclServer.log
4.Open the CAD application
5.Prepare the environment to track the single(s) action that creates the issue (i.e. open the browser, search for the right project/record in the tree)
6.Enable tracing as shown before
7.Perform the action(s) that reproduces the issue
8.Close the CAD application
9.Collect, zip and send Mechworks the following files:
•On the client %TMP%\DBWORKS_<date>_<time>.LOG
•[*] On the client %TMP%\DBWACLClient.log
•[*] On the server %PROGRAMDATA%\Mechworks\DBWACLServer\Logs\DBWAclServer.log
please note step marked with [*] are intended to be DBWAclServer specific; skip such steps in case the feature is not active or you were not asked to provide DBWAclServer specific logs.
TaskManager log files
In case the issue involves TaskManager or you have been asked by Mechworks Support Team to provide log for it, you've to send -together with standard log- also specific server log and a dump of TaskManager involved database tables (DBW_TASK_COMMANDS, DBW_TASK_EXEC_NODES, DBW_TASKS, DBW_TASKS_LOG); a zipped backup of the whole database (if not excessively large) is fine.
License Manager log files
Please note 2 logfiles are created:
•Server log: in the same folder of the MwLicenseManager.exe, named like MwLicenseManager_<yyyymmdd>.LOG
•Client log: in the %tmp% (temporary folder for current user), named like MwClientManager_<yyyymmdd>_<hhmmss>.LOG
In case no logfile is created on the server, it could be due to the fact the location of the service executable does not grant write permission to the service personality.
Often the %programfiles% and %programfiles(x86)% are not writable. In such cases try to install the service having the executable on a different location.
Installation log files
For issues occurred during installation process, please send us following logs created in the %tmp% folder:
•Dbw_msi_log.txt
•Dbw_msi_Exception_log.txt
•MSIxxxxxx.LOG (where xxxxx is a number)
Performance log files
Available from R26, a dedicated file named %TMP%\DBWORKS_PERF_<date>.log is generated to enable more detailed analysis of application performance.
It is activated together with the standard logs and can be collected, along with the others, using the CaptureMechWorksPdmLog tool available from the Windows Start menu for submission to Mechworks Support.
Customizing LogFile contents and location
It's possible to add customized string to the log file, so to make it better debuggable. The way to do that is the shell command AddToDebugLog.
You can change the location of the logfile from the system temporary folder (%TEMP%) to the user folder (MechWorks_Pdm_Server\USERS\<userfolder>) by setting the TRACE_CREATE_LOG_IN_USER_DIR parameter in DBWAppH.par file.
Please note usually the user folder is shared, so performaces may be affected by this setting.
Upload/download a file to/from MechWorks FTP site
For sending or receiving (large) files we provide our customer and resellers an FTP site.
Here below is the data for accessing it:
ftp site |
mechworks.smartfile.com |
|---|---|
login |
dbw_support |
password |
dbworks |
Please remember to notify Mechworks when the upload of files has finished so to optimize the issue scheduling time.
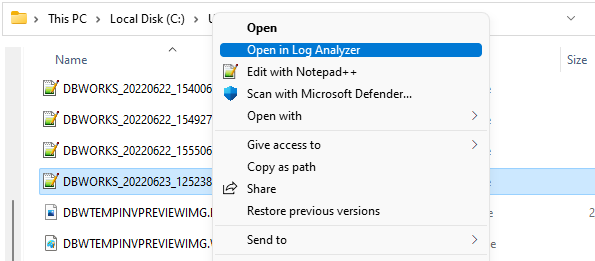
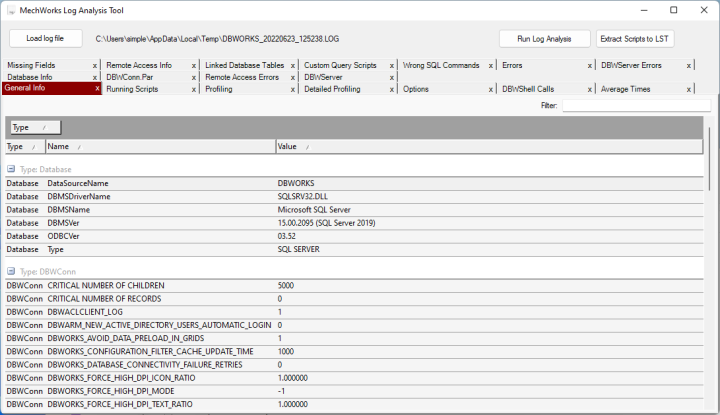
Log Analyzer
LogAnalyzer is a tool distributed included in the PDM setup and that's available through the start→application→Mechworks menu.
It allows an analisys of an already generated logfile, focusing on involved options, executed script, core procedures, etc... from a time consuming point of view (very useful to identify the bottleneck steps.
It is possible to add an entry to the windows RMB, so to directly click on the file to recall the analyzer on it.
To enable the RMB entry you've to run the following code saved as .reg file:
Windows Registry Editor Version 5.00
[HKEY_CLASSES_ROOT\SystemFileAssociations\.log\shell\Open in Log Analyzer\command]
@="C:\\Program Files (x86)\\MechWorks\\MechWorks_Pdm\\bin\\DBWLogToXMLTool\\DBWorksLogAnalyzer.exe \"%1\""
The result will be like followings: